Author Archive

Why clinical CROs hate eCRF systems – and why you should love them

Everything from banking to government services, from shopping to gambling has moved on-line in the past decade, yielding huge efficiency gains for suppliers and (for the most part) an improved experience for the customer.  Suppliers that have failed to adjust their business model are being slowly (or not slowly) ejected from the marketplace.

Against this background, then, it is surprising that such a high percentage of clinical trials are performed using simple pen and paper to record the raw data.  The classical paper Case Report Form (or CRF) has changed little in decades – and seems surprisingly entrenched against the assault of the digital age.

At first glance that seems understandable enough – after all, if you just want a flexible tool to record free-form information then pen and paper is still hard to beat.  The key word, some clinical researchers argue, is flexibility.  You never know what might happen, so its hard to predict in advance the kind of information you will need to capture.  Whatever the eventuality, the paper CRF can accommodate.  And anyway, it can never fail you – what happens to a digital system if the power fails or the internet connection goes down?

The flexibility is undeniable – we have all experienced on-line forms (even from large companies and government departments with huge IT budgets who should really know better) that simply will not allow you to enter the information you need to give them.  Quite simply the designer hadn’t put themselves in your particular situation when they designed the form.

As a result, digital forms work best for simple tasks (like booking a flight or buying a book) and much less well for complex tasks (such as completing your tax return).  There seems little doubt in which camp a clinical trial falls.

But managed correctly, this lack of flexibility is also the greatest strength of an electronic Case Report Form (or eCRF).  Flexibility in the hands of a genius is an unmitigated good – but flexibility gives people the opportunity to make mistakes.  Quite simply, the same digital system that frustrates and infuriates because it wont let you enter the right kind of information is performing a useful gatekeeper function when it prevents you entering errors.  An electronic form wont allow a body mass index of 235 or an age of 216 – errors that can be quickly and easily corrected if they are spotted in real time while the patient is still present, but much harder to correct when identified later.

Smart data entry doesn’t just catch errors.  It can also improve the quality of data by forcing free-form information into categories.  Categorical data can be subjected to statistical analysis more easily than unstructured text – and the originator of the data is much better placed to choose a category from a list than a data analyst attempting to throw a quadrat over the free-form data much later on.  There is no reason not to include a free text ‘notes’ field alongside the categories so that the full richness of the data that would have been captured on a paper form is also included in the eCRF.

Going digital can improve the quality of clinical data in other ways too.  Patient recorded outcomes are important end-points in many trials, but they are notoriously unreliable – they are subject to biases depending on how the questions are administered, as well as substantial variation from one day to the next.  The eCRF can help on both scores: using a computer, or even an iPad to administer the questionnaire removes the variability in presentation that inevitably occurs with a human operator.  Equally importantly, the ease and reliability with which the reporting tool can be self-administered allows data to be collected much more frequently – and time-averaged data is considerably more powerful than spot measures for highly variable end-points such as patient-reported outcome scales.

There is no reason in principle why the eCRF cannot be a truly interactive tool – providing information to the clinical researcher at the same time as the clinical researcher records information in the eCRF.  The eCRF becomes a dynamic manifestation of the protocol itself – reminder the researcher of the sequence of tests to be administered, or the individual steps of the protocol for more complex or lengthy procedures.  It can, of course, integrate information from the patient with the protocol to provide patient-specific instructions.  For example, in a recent clinical trial using the cutting-edge eCRF platform from Total Scientific, one of the end-points involved processing sputum samples.  The volume of reagents added to the sputum depended on the weight of the sputum plug – using a paper CRF would have required the clinical researcher to perform relatively complex calculations in real time while preparing the sputum sample; with the customised eCRF from Total Scientific the weight of the sputum plug was entered and the eCRF responded with a customized protocol for processing the sample with all the reagent volumes personalized for that particular sample.

A cleverly designed eCRF, then, is like having your own scientists permanently present at the clinical sites.  The eCRF is looking over the shoulder of every clinical research assistant and providing advice (in the form of the interactive protocol) and preventing errors.  This “real-time electronic monitoring” severely restricts the flexibility of the clinical researchers to do anything other than exactly what you intended them to do.  And this is why many clinical CROs do not like eCRFs. Loss of flexibility makes their job harder – but makes your clinical data better!

Of course, not all eCRFs are born equal.  Some deliver the restriction and lack of flexibility over data entry in return for only very limited data-checking.  Unless you really harness the power of using an eCRF rather than pen and paper, there is a danger it can cost more and deliver less.  But the advantages of well-designed eCRF, whose functionality has been matched to the needs of your particular protocol brings huge benefits in  data quality – which translate directly into increased statistical power.  Total Scientific’s bespoke eCRF platform, for example, uses individually-designed layouts grafted onto a powerful relational database engine to provide features that are difficult or impossible to realize using conventional eCRF products that are rigid and poorly-optimized for each new user (being little more than digital versions of the paper CRF they replace).

As a result, we provide features such as colour-coded dashboards for each patient visit that provide, at a glance, an indication to the clinical researcher which tasks have been completed and which remain outstanding, as well as user-defined options to display the blinded data in real-time so that outliers and trends in the data can be visualized and identified with an ease unimaginable in the days of paper-only data capture.

And the eCRF is still evolving.  At Total Scientific we are working on modules that implement statistical process control right into the eCRF itself.  Statistical process control is a well-established framework for monitoring complex systems, such a silicon chip fabrication plants.  By looking at all the data emerging from the process (whether chip manufacture or recruitment of patients) it spots when a significant deviation over time has taken place.  In the manufacturing setting, that allows the operators to halt production before millions of chips are made that will fail quality control.  In a clinical trial, statistical process control would identify any unexpected changes in baseline values that cannot be explained by random variation alone and flag them up – while the trial is still running.  While such artefacts can be identified in a conventional locked clinical database during data analysis, it is then too late to do anything about it (other than repeat the trial), and these common artefacts then substantially lower trial power.  Incorporating statistical process control into Total Scientific’s eCRF platform promises, for the very first time, to take clinical data quality to a new level.

If you are planning a trial and your clinical CRO is trying to convince you that the paper CRF system they have always used is better – more flexible and cheaper because they don’t have to learn a new system – then its time to list the benefits of a cutting-edge eCRF system.  They make not like the idea of “big brother” watching their every move – but that’s precisely why you should insist on it!

David Grainger
CBO, Total Scientific Ltd.

Constructing better multivariate biomarker composites

The earliest biomarkers, such a body temperature or blood pressure, were single measurements that reflected multiple physiological processes.  Today, though, our reductionist approach to biology has turned up the resolution of our lens: we can measure levels of individual proteins, metabolites and nucleic acid species, opening the biomarker floodgates.

But this increased resolution has not necessarily translated into increased power to predict.  The principal use of biomarkers after all is to use things that are easy to measure to predict more complex biological phenomena.   Unfortunately, the levels of most individual molecular species are, on their own, a poor proxy for physiological processes that involve dozens or even hundreds of component pathways.

The solution is to combine individual markers into more powerful signatures.   Biomarkers like body temperature allow physiology to perform the integration step.  But for individual molecular biomarkers that job falls to the scientist.

Unsurprisingly, the success of such efforts is patchy – simply because there are an infinite number of ways to combine individual molecular biomarkers into composite scores.  How do you choose between linear and non-linear combinations, magnitude of coefficients and even at the simplest level which biomarkers to include in the composite score in the first place?

The first port of call is usually empiricism.   Some form of prior knowledge is used to select an optimal combination.  For example, I may believe that a couple of biomarkers are more likely to contribute than others and so I may give them a stronger weighting in my composite score.   But with an infinite array of possible combinations it is hard to believe that this approach is going to come anywhere close to the optimum combination.

Unless you have a predictive dataset, however, this kind of ‘stab in the dark’ combination is the best you can do.  Just don’t be surprised if the resulting composite score is worse than any of the individual biomarkers that compose it.

With a dataset that combines measurements of each individual biomarker and the outcome being modeled, more sophisticated integration strategies become possible.  The most obvious is to test each individual marker in turn for its association with the outcome and then combine those markers that show a statistically significant association.  Perhaps you might even increase the weighting of the ones that are most strongly associated.

But how powerful are these ad hoc marker composites?

From a theoretical perspective, one might imagine the answer is not very powerful at all.  While common sense suggests that each time you add another marker with some new information in it the predictive power of the composite should improve, unfortunately this simple view is too, well, simple.   Each new marker added into a composite score contributes new information (signal) but also further random variation (noise).  To make a positive contribution, the additional signal has to be worth more than the additional noise.

Even when the data is available, asking whether each marker is significantly associated with outcome to be predicted is therefore only looking at one half of the equation: the signal.  It does little to quantify the noise.  Worse still, it doesn’t address whether the signal is “new” information.  Too often, the individual markers used to construct a composite are correlated with each other, so the value of each new marker is progressively reduced.

In sharp contrast, the random noise from different markers is rarely, if ever, correlated.  So each added marker contributes a full shot of noise, but a heavily diluted dose of signal.   Making biomarker composites more powerful than the best single marker is therefore no trivial exercise.

Here is a real-world example from Total Scientific’s own research that nicely illustrates the problem.  Angiography is widely used to visualize the coronary arteries of individuals suspected of having coronary heart disease.   The idea is to identify those at high risk of a heart attack and to guide interventions such as balloon angioplasty, stenting and bypass grafting.   In this respect, the angiogram represents a perfect example of a biomarker composite.  Measures of stenosis in all the major coronary artery regions are to be used to predict a clinical outcome (future heart attack).

At the top level it works well.  Treating the angiogram as a single marker yields useful prediction of future outcome.  Those with coronary artery disease are (unsurprisingly) at much higher risk of heart attack (Figure 1).

Association between death and angiography

Figure 1.  Association between the presence of disease detected by angiography and death following a myocardial infarction (upper table) or death unrelated to cardiovascular disease (lower table).  All data from the MaGiCAD cohort with median follow-up of 4.2 years.

As a useful control, the presence of coronary artery disease is not associated with death from non-cardiovascular causes.  Perhaps the most striking thing about this data, though, is the size of the effect.  People with a significant coronary artery stenosis are only at 3-fold excess of risk of dying from a heart attack in the following four years compared to those with no significant disease by angiography.

Is there more data in the angiogram?  For example, does the total amount of disease or even the location of the lesions provide better prediction of who will go on to suffer a fatal heart attack?  To address this question, we need to treat the angiogram as a collection of separate markers – a measurement of stenosis in each individual coronary artery region.

Among those with some disease, the total amount of atherosclerotic plaque does have some further predictive value (Figure 2).  But again, the most striking observation is the weak nature of the association.  Having a lot of disease versus a little puts you at only marginally greater risk of the fatal heart attack – the total amount of disease cannot be used as a guide as to where intervention is clinically justified.

ROC for total lesion score

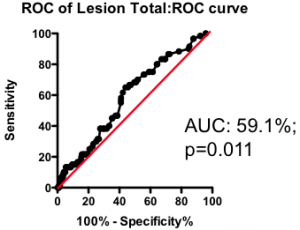
Figure 2.  Receiver-Operator Characteristic (ROC) curve using total lesion score to predict death as a result of a myocardial infarction (in the “diseased’ group only).  Total lesion volume is better than chance (which would have an AUC of 50%; p=0.011) but carries very little predictive power (a perfect test would have AUC = 100%, and each increment in AUC is exponentially more difficult to achieve).

If the total amount of disease has so little predictive power, does the location of the disease provide a more clinically useful guide?  Previous researchers have attempted to incorporate the location of the lesions into a biomarker composite score.  One example is the Jeopardy Score that assigns weights to disease in different regions of the arterial tree according the proportion of myocardial perfusion that would be lost due to a blockage in that region.  Plaques in proximal locations that cause a greater perfusion deficit ought, in principle, to be more dangerous than stenosis in more distal regions.

ROC for jeopardy score

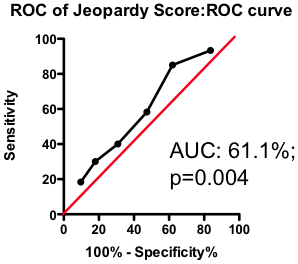
Figure 3.  ROC curve using Jeopardy Score to predict death as a result of a myocardial infarction.

Testing this biomarker composite, though, yields disappointing results (Figure 3).  The composite is no better than a simple sum of all the lesions present (compare Figure 2 and Figure 3).   More lesions (wherever they are located) will tend to increase Jeopardy Score, so its unsurprising that Jeopardy Score performs at least as well as the total extent of the disease.  But it is clear that the additional information about the perceived risk of lesions in different portions of the vascular had no further predictive value.

Does this mean that future risk of fatal heart attack is independent of where the lesions are located?  Not necessarily.  The Jeopardy Score biomarker composite was assembled based on a theoretical assessment of risk associated with proximal lesions.  But are proximal lesions really more risky?

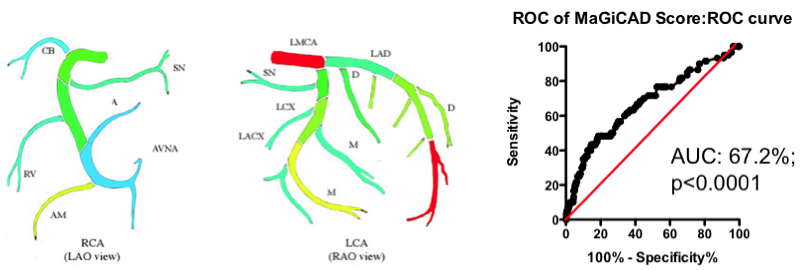
Yes and no.  Using the MaGiCAD dataset, we have constructed ‘heat maps’ showing where lesions were most likely to be located among the individuals who died from a heart attack during follow-up, compared with those who did not (Figure 4).  As expected, the left main stem (which feeds both the left anterior descending artery and the circumflex artery) was the site of the most dangerous plaques.  But the next most dangerous location was the distal portion of the circumflex and left anterior descending arteries.

Using this information create a revised Jeopardy Score based on the observed risk in the MaGiCAD dataset now yields a model that significantly improves on the published Jeopardy Score based on theoretical approximation (Figure 4; right panel).  This suggests there really is useful information encoded in the position of the lesions within the arterial tree.

Artery heat map and ROC curve for new weightings

Figure 4.  Left Panel: Heat map of the coronary artery tree showing the relative lesion volume among individuals who died following an MI during follow-up compared to those alive at the end of follow-up.  Dark red represents a 3-fold excess lesion volume among the cases; dark blue represents a 3-fold excess lesion volume among the controls.  Note that the highest risk lesions are located in the left main stem (LMCA), with risk graded from distal to proximal in the left anterior descending (LAD) and circumflex (LCX) arteries, while risk is graded from proximal to distal in the right coronary artery (RCA).  Right Panel: ROC curve using the weightings from the heat map (left panel) to predict death as a result of a myocardial infarction.

Is this the best predictive model you can generate?  Almost certainly not – it turns out that the location of the most dangerous lesions depends on other factors too.  The left main stem is dangerous in younger men (justifying its colloquial designation as the ‘widowmaker’) – but in men over the age of 65 and in women lesions in the left men stem are no more dangerous than those elsewhere in the arterial tree.

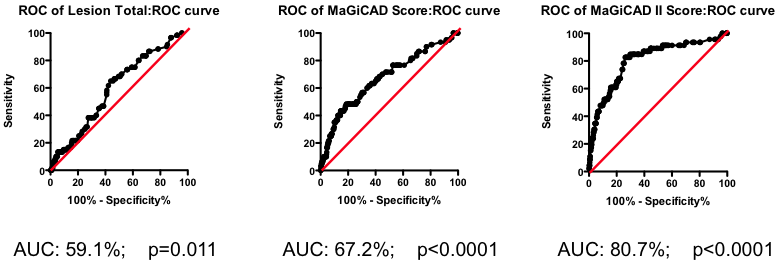
Mathematical tools exist to create optimized models combining all these different factors.  One example is the Projection to Latent Structures (or PLS) implemented using SIMCA.  Constructing a PLS model from the MaGiCAD data yields a yet more predictive model (Figure 5; right panel).  Figure 5 illustrates the gradual improvement in the performance of the biomarker composite as more sophisticated algorithms are used to weight the component markers.

All this nicely illustrates how data-driven optimization of biomarker composites can dramatically improve predictive power.  But it does not (yet) give us clinically useful insight.  Because the models have been derived using the MaGiCAD dataset, the ability to predict outcomes in the MaGiCAD cohort (so-called ‘internal predictions’) is likely to be artificially high.  This is particularly true of the PLS model, because PLS is a ‘supervised’ modeling tool (in other words, the algorithm knows the answer it is trying to predict).  Before we can start to use such a biomarker composite clinically, we need to test its ‘generalizability’ – how good it is at predicting death no matter where the angiogram was performed.

Evolution of the model

Figure 5.  Series of ROC curves demonstrating the improvement in predictive performance with more advanced algorithms for weighting the component markers derived from the angiogram.  Right Panel: ROC curve using the weightings from the PLS model of the MaGiCAD angiography dataset to predict death following a myocardial infarction.

Why might the model not be generalizable?  One obvious reason is that the outcome (death following myocardial infarction) may have been modulated by the intervention of the clinicians who performed the angiography – using the information in the angiogram itself.  It is perfectly possible that distal lesions appear to be the most risky precisely because clinicians perceive proximal lesions to carry the most risk and so treat proximal lesions more aggressively than distal ones.  If that were true, all our heat map would represent is the profile of intervention across the coronary artery tree rather than anything about the underlying biology.  Since patterns of interventions may vary between clinical teams, our highly predictive biomarker composite may apply uniquely to the hospital where the MaGiCAD cohort was recruited.

If this example does not provide all the answers, it should at least provide a list of questions you should ask before adopting published biomarker composites.  Just because a particular composite score has been used in many studies previously you should not assume it represents an optimal (or even a good) combinatorial algorithm.  Usually, combinations are assembled on theoretical (or even ad hoc) grounds and rarely are different combinations considered and compared.

Nor should you assume that combination of component markers will automatically be more powerful than any of the individual markers.  Because the noise in different markers is rarely correlated, but the signal component is more often than not highly correlated, the act of combination inherently reduces power, unless it has been done very carefully.

Before adopting a biomarker composite as an end-point in a clinical trial, you need to understand which components are contributing the greatest noise and which contain the dominant signal.  The results of such an analysis may surprise you.

But most importantly of all, you should recognize that the superficially straight-forward task of combining individual biomarkers is not a task for the uninitiated.  Injudicious combination will reduce rather than increase your power, and even with the most powerful statistical tools available today developing superior biomarker composites is a slow and painstaking task, with no certainty that the composite score that emerges will be much superior to its components.  In short, biomarker composites are more likely to be your problem than your solution.

David Grainger
CBO, Total Scientific Ltd.

The HDL myth: how misuse of biomarker data cost Roche and its investors $5billion

On May 7th 2012, Roche terminated the entire dal-HEART phase III programme looking at the effects of their CETP inhibitor dalcetrapib in patients with acute coronary syndrome.  The immediate cause was the report from the data management committee of the dal-OUTCOMES trial in 15,000 patients that there was now no chance of reporting a 15% benefit with the drug.

The market reacted in surprise and disappointment and immediately trimmed $5billion of the market capitalization of Roche.  After all, here was a class of drugs that had been trumpeted by the pharma industry as the next “super-blockbusters” to follow the now-generic statins. The data from dal-OUTCOMES has dealt that dream a fatal blow.

The important lesson, however, is that such a painful and expensive failure was entirely preventable, because the dream itself was built on a fundamentally flawed understanding of biomarkers.   And that’s not speaking with the benefit of hindsight: we predicted this failure back in January 2012 in the DrugBaron blog.

On May 7th 2012, Roche terminated the entire dal-HEART phase III programme looking at the effects of their CETP inhibitor dalcetrapib in patients with acute coronary syndrome. The immediate cause was the report from the data management committee of the dal-OUTCOMES trial in 15,000 patients that there was now no chance of reporting a 15% benefit with the drug.

The market reacted in surprise and disappointment and immediately trimmed $5billion of the market capitalization of Roche. After all, here was a class of drugs that had been trumpeted by the pharma industry as the next “super-blockbusters” to follow the now-generic statins. The data from dal-OUTCOMES has dealt that dream a fatal blow.

The important lesson, however, is that such a painful and expensive failure was entirely preventable, because the dream itself was built on a fundamentally flawed understanding of biomarkers. And that’s not speaking with the benefit of hindsight: we predicted this failure back in January 2012 in the DrugBaron blog.

CETP inhibitors boost HDL (the so-called “good cholesterol”) by inhibiting the Cholesterol Ester Transfer Protein (CETP), a key enzyme in lipoprotein metabolism. And they work! HDL cholesterol concentrations are doubled soon after beginning treatment, more than reversing the depressed HDL levels that are robustly associated with coronary heart disease (and indeed risk of death from a heart attack).

That was quite a firm enough foundation for developers to believe that CETP inhibitors had a golden future. After all, HDL is the “best” biomarker for heart disease. By that I mean that, of all the lipid measures, HDL gives the strongest association with heart disease in cross-sectional studies and is the strongest predictor of future events in prospective studies. Since we know lipids are important in heart disease (from years of clinical experience with statins), therefore elevating HDL with CETP inhibitors just HAS to work. Right?

Wrong.

Strength of an association is just one factor in the decision as to whether a biomarker and an outcome are linked.  Unfortunately, Sir Austin Bradford Hill put it first in his seminal list of criteria published in 1963 and still widely used today.  And he didn’t  provide a strong enough warning, it seems, that it is only one factor out of nine that he listed.   Total Scientific updated those criteria for assessing modern biomarker data in 2011, and stressed how the strength of an association could be misleading, but obviously that was too late for Roche who were already committed to a vast Phase 3 programme.

Here’s the problem with HDL. HDL cholesterol concentrations are temporally very stable – they do not change a great deal from one day to the next, or even for that matter from one month to the next. A single (so-called ‘spot’) measure of HDL cholesterol concentration, therefore, represents an excellent estimate of the average concentration for that individual over a substantial period.

Other lipid parameters do not share this characteristic. Triglyceride concentration, for example, changes not just day by day but hour by hour. Immediately following a meal, triglyceride levels rise dramatically, with the kinetics and extent of the change dependent on the dietary composition of the food and the current physiological status of the individual.

These temporal variation patterns bias how useful a spot measure of a biomarker is for a particular application. If you want to predict hunger or mood (or anything else that varies on an hour-by-hour timescale) triglycerides will have the advantage – after all, if HDL doesn’t change for weeks it can hardly predict something like hunger. By contrast, if you want to predict something like heart disease that is a very slowly progressing phenotype, the same bias favours a spot measure of HDL over a spot measure of triglycerides.

HDL cholesterol concentration, then, as a biomarker has an in-built advantage as a predictor of heart disease IRREPESECTIVE of how tightly associated the two really are, and most critically IRRESPECTIVE of whether there is a real causative relationship between low HDL and cardiovascular disease.

All this matters a great deal because all the lipid parameters we measure are closely inter-related: low HDL is strongly associated with an elevated (on average) triglyceride and LDL. For diagnosing patients at risk of heart disease you simply pick the strongest associate (HDL), but for therapeutic strategies you need to understand which components of lipid metabolism are actually causing the heart disease (while the others are just associated as a consequence of the internal links within the lipid metabolism network).

Picking HDL as a causative factor primarily on the basis of the strength of the association was, therefore, a dangerous bet – and, as it turns out, led some very expensive mistakes.

Okay, so the structural bias towards HDL should have sounded the alarm bells, but surely it doesn’t mean that HDL isn’t an important causative factor in heart disease? Absolutely correct.

But this isn’t the first “death” for the CETP Inhibitor class. As DrugBaron pointed out, the class seemed moribund in 2006 when the leading development candidate, Pfizer’s torcetrapib, failed to show any signs of efficacy in Phase 3.

As so often happens, when observers attempted to rationalize what had happened, they found a ‘reason’ for the failure: they focused on the small but significant hypertensive effect of torcetrapib – a molecule-specific liability. An argument was constructed that an increase in cardiovascular events due to this small increase in blood pressure must have cancelled out the benefit due to elevated HDL.

That never seemed all that plausible – unless you were already so immersed in ‘the HDL myth’ that you simply couldn’t believe it wasn’t important. To those of us who understood the structural bias in favour of HDL as a biomarker, the torcetrapib data was a strong premonition of what was to come.

So strong was ‘the HDL myth’ that voices pointing out the issues were drowned out by the bulls who were focused on the ‘super-blockbuster’ potential of the CETP inhibitor class. Roche were not the only ones who continued to believe: Merck have a similar programme still running with their CETP Inhibitor, anacetrapib. Even the early data from that programme isn’t encouraging – there is still no hint of efficacy, although they rightly point out that there have not yet been enough events analysed to have a definitive answer.

But the signs are not at all hopeful. More than likely in 2012 we will have the painful spectacle of two of the largest Phase 3 programmes in the industry failing. Failures on this scale are the biggest single factor dragging down R&D productivity in big pharmaceutical companies.

Surely the worst aspect is that these outcomes were predictable. What was missing was a proper understanding of biomarkers and what they tell us (or, perhaps in this case, what they CANNOT tell us). Biomarkers are incredibly powerful, and their use is proliferating across the whole drug development pathway from the bench to the marketplace. But like any powerful tool, they can be dangerous if they are misused, as Roche (and their investors) have found to their substantial cost. Total Scientific exist to provide expert biomarker services to the pharmaceutical industry – let’s hope that not bringing in the experts to run your biomarker programme doesn’t cost you as much as it did Roche.

Dr. David Grainger
CBO, Total Scientific

Combinatorial animal study designs

It is sometimes assumed that government regulations governing the use of animal models in drug development hamper good science, either by accident or design. But reality is rather different: focus on the 3Rs of replacement, reduction and refinement can lead to more reliable results, quicker, at lower cost and with improved animal welfare and reduced animal use as well.

There are a number of strategies that can reduce the number of animals used during the development of a new drug. The most obvious is to combine several types of study, investigating efficacy, safety and drug disposition simultaneously. As well as reducing the number of animals required, it has scientific benefits too: instead of relying on measuring drug levels to assess exposure, you can observe the safety of the drug in exactly the same animals where efficacy is investigated. For drugs with simple distribution characteristics, measuring exposure in the blood is useful for comparing different studies, but as soon as the distribution becomes complex (for example, with drugs that accumulate in some tissues, or are excluded from others) comparing different end-points in different studies becomes challenging and fraught with risk of misinterpretation.

Quite simply, then, its simply better to look at safety and efficacy in the same animals in the same study. The results are easier to interpret, particularly early in drug development when knowledge of distribution characteristics may be imperfect. Not only is it scientifically better, but it reduces the use of animals, and it reduces the overall cost of obtaining the data. A combination study may be as much as 30% cheaper than running two separate studies.

For these reasons, Total Scientific plan to launch in 2012 a comprehensive range of combination study packages, combining our industry-standard models of chronic inflammatory diseases with conventional assessment of toxicity, including clinical chemistry, haematology, urinalysis, organ weights and histopathology. For anyone involved in early stage drug development in immunology and inflammation, these study designs will offer more reliable de-risking of an early stage programme at a lower cost than conventional development routes.

If the data is better and the costs are lower, why haven’t such combination designs become the norm before now? Perhaps its because of a misunderstanding of what kind of safety information is needed during the early stages of developing a first-in-class compound. Conventional toxicology (such as that required for regulatory filings) requires driving dosing levels very high to ensure that adverse effects are identified. Clearly, for a drug to be successful, the adverse events must be occurring at much higher doses than the beneficial effects – which is at odds with a combination study design.

That’s fine once you have selected your clinical candidate (and conventional toxicology studies of this kind will still be needed prior to regulatory submission even if you ran a combination study). But for earlier stage development, the combination design makes perfect sense: before you ask how big the therapeutic index might be, first you simply want to know whether it is safe at the doses required for efficacy.

A previous blog by DrugBaron has already commented on the over-focus on efficacy in early drug development as a contributor to costly attrition later in the pipeline. Why would you be interested in a compound that offered benefit but only at doses that cause unacceptable side-effects (whether mechanism-related or molecule-specific it matters not)? Continuing to invest either time or money in such a compound ignorant of the safety issues until later down the path is a recipe for failure.

Looking at early stage opportunities being touted for venture capital investment paints a similar picture: almost all have, as their centerpiece, a compelling package of efficacy data in one (or often several) animal models. Far fewer have any assessment of safety beyond the obvious (that the animals in the efficacy studies survived the treatment period). Since almost any first-in-class compound, by definition hitting a target unvalidated in the clinic, is associated with “expected” side-effects, this lack of any information to mitigate that risk is the most common reason for failing to attract commercial backing for those early stage projects. Total Scientific’s combination study designs rectify these defects, reducing risk earlier, and at lower cost.

Why stop there? Relatively simple changes to the study design also allow investigation of pharmacokinetics, metabolism and distribution – all in the same animals where efficacy and safety are already being investigated. Such “super-studies” that try and address simultaneously many different aspects of the drug development cascade may be unusual, and may not provide definitive (that is “regulator-friendly”) results for any of the individual study objectives. However, in early stage preclinical development they will provide an extremely cost-effective method of identifying potential problems early, while reducing use of animals still further.

Combining different objectives into one study is only one way Total Scientific refines animal model designs in order to reduce animal requirements. Being biomarker specialists, we can improve the phenotyping of our animal models in several different ways. Firstly, by using multiple end-points (and an appropriate multi-objective statistical framework) we can detect efficacy with fewer animals per group than when relying on a single primary end-point. There can be no doubt that a single primary end-point design, used for regulatory clinical studies for example, is the gold-standard – and is entirely appropriate for deciding whether to approve a drug. But once again its not the most appropriate design for early preclinical investigations. It’s much better to trade a degree of certainty for the extra information that comes from multiple end-points. In any case, the consistency of the whole dataset provides that certainty in a different way.

Learning how a new compound affects multiple pathways that compose the disease phenotype provides a lot of additional value. In respiratory disease, for example, understanding whether the effect is similar on neutrophils and eosinophils, or heavily biased towards one or the other provides an early indication as to whether the compound may be more effective in allergic asthma or in severe steroid-resistant asthma. Compounds that hit multiple end-points in an animal model are much more likely to translate to efficacy in the clinic.

Equally importantly, we focus on end-points that have lower inter-animal variability – and hence greater statistical power. There is a tendency for end-points to become established in the literature simply on the basis of being used in the first studies to be published. Through an understandable desire to compare new studies with those that have been published, those initial choices of end-points tend to become locked in and used almost without thinking. But often there are better choices, with related measures providing similar information, but with markedly better statistical power. This is particularly true of semi-quantative scoring systems that have evolved to combine several measures into one number. Frequently, most of the relevant information is in one component of the composite variable, while others contribute most of the noise – destroying statistical power and requiring larger studies.

What all these refinements have in common is that they improve the quality of the data (driving better decisions), while reducing the number of animals required on the other (with ethical and cost benefits). Its not often you get a win:win situation like this – better decisions typically cost more rather than less. But the forthcoming introduction of Total Scientific’s new range of preclinical model study designs promises benefits all round.

Dr. David Grainger
CBO, Total Scientific

The interleukin lottery: playing the odds on numbers 9 and 16

The interleukins are an odd family.  One name encompasses dozens of secreted proteins that are linked by function rather than by structure.  And even that common function is very broadly defined: cytokines that communicate between cells of the immune system.

Defined in such a way, its perhaps not surprising that the interleukins have yielded some of the best biomarkers of inflammatory disease conditions, and even more importantly are the target for a growing range of antibody therapeutics.  Interfering with interleukins is to biologicals what GPCRs are to small molecule drugs.

As with GPCRs, though, despite the success of interleukins as biomarkers and drug targets, some members of the superfamily are extensively studied and well understood, while others lie on the periphery largely ignored.  Type interleukin-1 into PubMed and it returns a staggering 54690 papers.  Repeat the exercise for the rest of the interleukins and you make an interesting discovery: although there is a slight downward trend across the family (probably reflecting the decreasing time since each was first described), there are a couple of striking outliers (Figure 1).  Family members who are much less well studied than the rest.   IL-9 has only 451 citations, IL-16 has 414 and IL-20 just 98.

Figure 1 : PubMed Citations for the Interleukin Family in December 2011. Note the log scale.

Are they really less interesting?  Or does this just reflect the positive re-enforcement of previous publications?  Once one paper links a particular interleukin with a disease or physiological process, a crop of papers exploring that link quickly appear, casting in concrete the random process of discovery.  If that’s correct, these unloved interleukins might make excellent targets for research and drug discovery.

Take IL-9 for example: what little is known about this cytokine certainly doesn’t paint a picture of a backwater function undeserving of attention.  IL-9 is a product of CD4+ T cells (probably one of the Th2 group of cytokines that includes the much-studied IL-4 and IL-5) that promotes proliferation and survival of a range of haemopoietic cell types.  It signals through the janus kinases (jaks) to modulate the stat transcription factors (both of which are validated drug targets in inflammatory diseases).  Polymorphisms in IL-9 have been linked to asthma, and in knockout animal studies the gene has been shown to be a determining factor in the development of bronchial hyper-reactivity.

IL-16 looks no less interesting.  It is a little known ligand for the CD4 protein itself (CD4 is one of the most extensively studied proteins in all of biology, playing a key role on helper T cells, as well as acting as the primary receptor for HIV entry).  On T cells, which express the T Cell Receptor (TCR) complex, CD4 acts an important co-stimulatory pathway, recruiting the lck tyrosine kinase (a member of the src family, and itself and interesting drug target being pursued by, among others, the likes of Merck).  But CD4 is also expressed on macrophages, in the absence of the TCR, and here it is ligand-mediated signaling in response to IL-16 that is likely to be the dominant function.

Another interesting feature of IL-16 is the processing it requires for activity.  Like several other cytokines, such as TGF-beta, IL-16 needs to be cleaved to have biological activity.  For IL-16 the convertase is the protease caspase-3, which is the lynchpin of the apoptosis induction cascade, tying together cell death and cell debris clearance.

Like IL-9, polymorphisms in the human IL-16 gene have also been associated with chronic inflammatory diseases, including coronary artery disease and asthma.  But perhaps the most interesting observations relating to IL-16 come from biomarker studies.  Our own studies at Total Scientific in our extensive range of preclinical models of chronic inflammatory diseases have repeatedly found IL-16 to be the best marker of disease activity.   In human studies, too, IL-16 levels in both serum and sputum have been associated with inflammatory status, particularly in asthma and COPD but also in arthritis and IBD.

After years in the backwater, perhaps its time for the ‘ugly ducklings’ of the interleukin family to elbow their way into the limelight.  After all, the rationale for adopting either IL-9 or IL-16 as a diagnostic biomarker, or even as a target for therapeutic intervention, is as good as the case for the better known interleukins.  But the competition is likely to be less intense.

Many years ago, the Nobel laureate Arthur Kornberg, discoverer of DNA polymerase, once said “If, one night, you lose your car keys, look under the lamppost – they may not be there, but it’s the only place you have a chance to find them”.  Sound advice – unless, of course, there are twenty others already searching in the pool of light under the lamppost.  Maybe the twinkle of metal in the moonlight may be your chance to steal a march on the crowd.

Dr. David Grainger
CBO, Total Scientific

Environmental Pollutants: Opening a Soup-Can of Worms

They are everywhere: so called ‘present organic pollutants’, or POPs for short.   Since almost all the everyday items that make modern life so much easier emerged from a chemical factory, its not surprising that environmental contamination with organic chemicals is increasing all the time – even ‘environmentally aware’ Western countries.  But maybe it will surprise you to learn they are in your food as well.

New data, published in the Journal of the American Medical Association last week, showed that eating canned soup increased exposure to the compound Bisphenol A (BPA).  Since BPA is a component of many plastics, and is found in lots of food packaging and particularly in cling film, its been known to find its way into food for many years.

In response to the latest study, suggesting that canned food, as well as plastic-wrapped food, can be contaminated with BPA (since modern tin cans, as well as not being made of tin, also have a plastic inner lining), the Food Standards Agency in the UK moved quickly to quell fears:  “Our current advice is that BPA from food contact materials does not represent a risk to consumers” they said.

But is that true?

A British Heart Foundation funded project at the Universities of Exeter and Cambridge have been using the Total Scientific biomarker platform to investigate this question in some detail.  And while the results are not yet conclusive, there is certainly no reason to be complacent.  If the Food Standards Agency had said “There is presently no conclusive evidence that BPA from food contact materials represents a risk to consumers” they would have been correct – but the absence of evidence is certainly not the same thing as the absence of risk.  A more cautious approach is almost certainly warranted.

BPA is an organic compound classified as an ‘endocrine disruptor’: that is, a compound capable of causing dysfunction to hormonally regulated body systems. More than 2.2 million metric tonnes of BPA are produced worldwide each year for use mainly as a constituent monomer in polycarbonate plastics and epoxy resins. Widespread and continuous human exposure to BPA is primarily through food but also through drinking water, dental sealants, dermal exposure and inhalation of household dusts. It is one of the world’s highest production volume compounds and human biomonitoring data indicates that the majority (up to 95%) of the general population is exposed to BPA, evidenced by the presence of measurable concentrations of metabolites in the urine of population representative samples.

In 2008, our collaborator Professor David Melzer in Exeter published the first major epidemiological study to examine the health effects associated with Bisphenol A. They had proposed that higher urinary BPA concentrations would be associated with adverse human health effects, especially in the liver and in relation to insulin, cardiovascular disease and obesity. In their human study higher BPA concentrations were associated with cardiovascular diagnoses (with an Odds Ratio per 1SD increase in BPA concentration  of 1.39, 95% CI 1.18-1.63; p=.001 with full adjustment).  Higher BPA concentrations were also associated with diabetes (OR per 1SD increase in BPA concentration, 1.39;95% CI 1.21-1.60;p<.001) but not with other common diseases.

What that study did not do, however, was determine whether increased exposure to BPA was causing the increase in cardiovascular disease, or was an association due to some confounding factor.

Using our MaGiCAD cohort, these researchers have attempted to replicate these previously published associations, and using the prospective component of MaGiCAD should allow a first indication of whether any observed associations are actually causal.  If exposure to BPA really does increase the risk of heart disease, the implications for safety assessment of BPA and other POPs is significant: we may have to re-evaluate our use of BPA and introduce tighter controls on existing and new chemicals to which people are commonly exposed.

The problem is that it is really difficult to detect a weak, but significant, association between a common exposure and a highly prevalent disease, such as coronary heart disease.  Worse still, because the exposure is so common, even a relatively small increase in risk among those exposed could contribute a significant fraction of the population burden of heart disease, the biggest cause of death in the UK today.  And with every possibility that it is chronic low dose exposure over decades that is responsible for any damaging effects, it is difficult to envision how we could determine whether such POPs are safe enough to justify their use – at least until the harms they cause are detected decades after their widespread adoption.

Indeed, past history shows that chemicals can be very widely used before their harmful effects become known.  The insecticide DDT, or the carcinogenic food dyes such as Butter Yellow are good examples.  It is easy to assume in the 21st Century that our regulations and controls are good enough to prevent a repeat of these mistakes.

But the emerging data on BPA suggests that this is no time to be complacent.  Just because of the sheer scale of the exposure over so many years, it is far from impossible that BPA has caused more illness and death than any other organic pollutant.

The results from our studies, and other parallel studies by the same researchers, have just been submitted for scientific journals for peer review.  It is only appropriate that the results are released in this way, after rigorous scrutiny by the scientific community (in so far as peer review is ever rigorous).  But those results, when made public, will only add to the concern being expressed about BPA.  There may not yet be a conclusive answer as to the safety of BPA, but it is already time to ask just how much evidence will be needed before it is time to act to reduce our exposure.  Do we need to prove beyond all doubt that it is harmful, or will a “balance of probabilities” verdict suffice?

This is more a question of public policy than epidemiology.  A previous government was willing to ban beef on the bone when the evidence of risk to the population from that route was negligible.  Society needs to make some clear and consistent decisions when to act.  Ban passive smoking, allow cigarettes and alcohol, ban cannabis, allow BPA contamination but ban T-bone steaks.  Sometimes it seems like the decisions made to protect us have very little to do with the evidence at all.

What this study definitely has done, however, is expand still further the range of questions that have been investigated using our biomarker platforms.  Biomarkers may find the bulk of their applications in disease diagnostics and in clinical trials of new therapeutics, but the work on BPA proves that they are also very well suited to complex epidemiological investigations.  Biomarkers, it seems, can do almost everything – except inform the decision about what measures to take in response to the knowledge gained.  Sadly, the politicians are not very good at that either.

Smoke Screen: The intensifying debate about population screening generates more heat than light

If a test with prognostic value exists, should it be used for population screening? On the face of it, it’s a simple question, but it doesn’t have a simple answer.  Like most things in life, it depends on the context: how prevalent and how dangerous is the disease?  How invasive and how expensive is the test?

So if we are dealing with cancer, which can be fatal if not diagnosed early, and a screening test such as a mammogram or a blood test for PSA, then it seems obvious that the case for population screening must be impregnable.  Such was the basis for the wave of enthusiasm for screening twenty or thirty years ago that lead to the introduction of a number of national screening campaigns, of which mammography was only the most high profile.

But the pendulum has swung the other way: October 2011 saw the US Preventative Services Task Force conclude that the mortality benefit of PSA screening for prostate cancer was small to none, while in the UK the NHS announced a review of the evidence for the effectiveness of its flagship breast cancer screening programme, after recent research suggested the benefits were being exaggerated.

If earlier diagnosis really does improve the outcome for those patients, what can possibly be the problem?  The problems are two-fold: over-diagnosis and cost-effectiveness.

The “obvious” case for screening focuses entirely on the benefit gained by the ‘true positives’ – that is, the people who are correctly identified as having the disease.  On the negative side is the harm done to the ‘false positives’ – the people who are treated for the disease, but who did not really have it.  This harm can be significant, both physically and mentally.  Being told you have cancer can be traumatic enough (interpreted by many people, even today, as an automatic death sentence), but undergoing an unnecessary mastectomy, or having an unnecessary course of radiotherapy or chemotherapy is arguably even tougher.

A quantitative accounting of benefit and harm is tricky because the benefit (in terms of the harm avoided) and the harm of over-diagnosis (in the terms of the side-effects of the treatment) are different and so difficult to compare.   But the number of people affected by each outcome is easy enough to ascertain: for a test with 90% sensitivity and specificity (so better than most diagnostic tests in clinical use) applied to a disease like breast cancer with an incidence of 5 per 10,000 per year, and the numbers look something like this:

For every million people screened, you will make a correct early diagnosis of 450 of the people who will go on to get breast cancer; the remaining 50 will be missed (but of course, all 500 would have had to wait until clinical symptoms were obvious in the absence of a screening programme).  That looks pretty good.

But a specificity of 90% means 10 ‘false positives’ in every hundred people screened.  That is a shocking 10,000 people given a positive diagnosis when in fact they did not have cancer at all!

Suddenly, the performance of the test doesn’t look so great.  Of the 10,450 people given a positive diagnosis only just over 4% really had cancer.  Fully 20 people were given a wrong diagnosis for every one that was correctly identified.  Clearly, that’s not a good enough performance to initiate treatment (whether mastectomy or chemotherapy).

Even if the test had been 99% specific, the ‘false positives’ still outnumber the real positives by more than two to one.

What this quantitative analysis clearly shows is that to have any chance of being useful for population screening (at least for a relatively rare condition, such as cancers) the usual kind of diagnostic performance criteria have to be replaced with a new paradigm where it is the decimal fractions after the 99% specificity that are being scrutinized prior to introducing the test.  Few, if any, molecular tests can reach this level of performance (at least while retaining any useful degree of sensitivity at the same time).   The US Preventative Services task force was certainly right to conclude that PSA testing, which most definitely doesn’t approach this level of diagnostic performance, has little value when used in screening mode.

Let me correct that:  PSA testing, when used in screening mode, does a whole lot more harm than good.  The US Preventative Services review found that over a 10-year period, 15-20% of men had a positive test triggering a biopsy (of which at least 80% were false positives).  The biopsy itself is not free from harm, being accompanied by fever, infection, bleeding, urinary incontinence and pain.  But the damning evidence comes from the trials of intervention in prostate tumour identified through screening.  Here, there was a small reduction in all-cause mortality following surgery or radiotherapy, but only in men under 65; by contrast, there was a 0.5% peri-operative mortality rate associated with surgery and a big increase in bowel dysfunction and urinary incontinence in the radiotherapy group.  The review rightly concluded that the screening programme yielded questionable benefits but at the cost of substantial harms.

With that kind of conclusion, there is no need to even enter into a cost effectiveness assessment.  Clearly, population screening is inherently costly (because of the very large number of tests that must be performed).  Even when the unit cost of the test is very low indeed, the cost burden is substantial.  Even if there were a net benefit (and the argument is closer for mammographic screening in breast cancer than it is for PSA screening and prostrate cancer), the cost effectiveness of the screening programme would not approach the levels required to justify spending on a new therapeutic product (at least not based on current NICE cost effectiveness frameworks).  A back of the envelope calculation suggests that mammography would have to be at least 10-fold cheaper than at present to win approval if it were a therapeutic.

Proponents of screening are quick to argue that the solution lies in proper stratification before applying the test – so instead of screening the whole population, only a higher risk sub-group is screened.  The stratification might be on the basis of age, or symptoms or some other demographic (indeed, such stratification takes place even in the current ‘universal’ breast cancer screening programme in the UK, since males are not screened even though breast cancer can and does occur, albeit at a much lower prevalence, among men).

Fine.  But if you want to incorporate stratification into the screening paradigm, it’s critical that the data on the performance of the test is gathered using that same paradigm.  This kind of oversight can over-estimate the value of a test that discriminates very well between disease and the general healthy population but discriminates poorly between the disease and similar maladies with which it shares symptoms.   This has proven to be the difficulty for many, if not all, of the new range of molecular colon cancer tests currently in development.  These molecular tests typically have a reasonably good sensitivity and specificity when comparing colon cancer with the general healthy population (achieving, perhaps, 90% sensitivity and specificity in the best studies).  That, though, as we have already seen, is nowhere near good enough performance to adopt as a general population screening tool.  No matter, suggest the proponents of such tests: lets instead use it only in people with symptoms of colon cancer (such as fecal occult blood, intestinal pain or changes in bowel habits for example).  Now, with a prevalence of colon cancer of 10-20% in this group, a test with 90% specificity would be more attractive – at least now the number of real positives might (just) outnumber the ‘false positives’.  True, but only if the test still has 90% specificity in this selected patient group!  In most cases, sadly diagnostic performance falls away once you have stratified the subjects, precisely because the chance of a positive test is increased by inflammatory bowel conditions as well as by cancer.  There is nowhere left to go: for a test like this, there is no application in which it is sufficiently useful to justify clinical adoption (even if it were not a premium priced molecular test).

Janet Woodcock, Director of the Centre for Drug Evaluation and Research (CDER) at the FDA summed it up perfectly at the recent US conference on Rare Diseases and Orphan Products, saying “How can something that is so widely used have such a small evidence base?  The FDA has never accepted PSA as a biomarker for that very reason – we don’t know what it means.”

What the analysis presented here proves is that you need a low cost, minimally burdensome test with superb diagnostic power coupled with a reasonably prevalent, but very nasty, disease that clearly benefits from early diagnosis and treatment.  That’s a pretty demanding set of criteria.

Neither this analysis, nor the review of the US Preventative Services team, published on October 11th, proves that PSA screening is not useful because it depends on a subjective trade-off of benefits and harms (and in any case, some statisticians have been quick to point out some inadequacies in the meta-analysis framework that was used).  But the evidence that prostate cancer really does benefit a great deal from early diagnosis and aggressive treatment is weak, and PSA testing certainly doesn’t have outstanding diagnostic performance.  So the weight of argument is certainly heavily stacked against it.

For colon cancer, there is no doubt that the disease is relatively prevalent and benefits from early diagnosis and treatment.  By contrast, the tests that are available (whether immuno-FOBT or newer molecular tests) are nowhere near good enough in terms of diagnostic performance to justify use in a screening programme.

For breast cancer, the case is the strongest of the three.  Again, there is clear benefit from early diagnosis and treatment, and the test itself has the greatest diagnostic power.  The question is simply whether it is good enough.  It will be interesting indeed to read the conclusions of Sir Mike Richards, National Cancer Director for the UK, who has been charged with reviewing the evidence.  It will be even more interesting to see whether they use this opportunity to attempt a cost-effectiveness assessment, using a framework similar to NICE, at the same time.  After all, the breast cancer screening programme is paid for out of the same global NHS budget as all the rest of UK healthcare, including, interestingly, treatment for breast cancer with expensive new drugs such as Herceptin™.  It would be fascinating to know whether screening or more rapid treatment once symptoms appear would result in the best use of the available cash for the benefit of breast cancer sufferers in the UK.  Sadly, if the nature of the debate on PSA is anything to go by, I doubt the review will yield that much clarity.

The emotional, but evidence-light, arguments in favour of screening exert enormous pressure on healthcare providers.  For example, the American Urological Association (AUA) condemned the US Preventative Services report on prostate cancer screening, saying the recommendations against PSA “will ultimately do more harm than good to the many men at risk for prostate cancer” – although they provided no evidence to support their emotive statement.  After all, the general population find it hard to imagine how screening can possibly be harmful.   The debate will no doubt continue generating much heat, and only a little light.  Sadly, despite all the evidence to the contrary it is very hard to see wasteful and possibly even harmful national screening programmes being halted any time soon.

Dr. David Grainger
CBO, Total Scientific

Personalized Medicine Demands Investment in Innovative Diagnostics: Will the Returns be High Enough?

Several very senior pharma executives were recently overhead by a journalist discussing what each of them viewed as the most important changes in the way healthcare will be delivered over the coming decade.  Each of them listed several such factors, including increased payor pressure on prices, the mounting regulatory burden and the shift toward orphan indications, but there was unanimity on just one factor: the importance of personalized medicine.

Personalized medicine is the great white hope for the pharmaceutical industry: by only treating the fraction of the population who can benefit from a particular medicine, efficacy and value-for-money are substantially increased.  But the prices set by Pfizer and Abbott for lung cancer drug Xalkori™ (a dual c-met and ALK kinase inhibitor) and its companion diagnostic (a FISH assay for translocations affecting the ALK genes) following its US approval last week, while on the face of it being unremarkable, nevertheless raise questions about the personalized medicine business model.

Xalkori™ crizotinib will cost $9,600 per month, yielding $50k to $75k per patient for the full treatment regimen – expensive, but pretty much in line with other newly approved medicines for small patient groups (only about 5% of non-small cell lung carcinomas – those with transloactions affecting the ALK gene cluster – are amenable to treatment with this drug).

The Vysis ALK Break Apart™ FISH probe test, from Abbott, which identifies the patient subset sensitive to treatment with Xalkori™, by contrast, will cost less than $250 per patient.  Again, this is entirely consistent with pricing structure of DNA-based diagnostics used in the clinic.

So if there is nothing surprising about these prices, what’s the problem?  The distribution of income between the drug developer and the diagnostic developer is heavily biased towards the drug.  It’s not as extreme as the unit prices for the products suggest, because the diagnostic should be applied to a wider population to identify the target population.  So with 100 non-small cell lung carcinoma patients tested with diagnostic (raising $25,000 revenue for Abbott), 5 will be identified who are suitable for treatment with Xalkori™ (raising $375,000 revenue for Pfizer), assuming full penetration of the market in both cases.  The diagnostic product, therefore, garners about 6% of total spend on the test and drug combined.

There are lots of obvious reasons why this is the case: the cost of developing the drug product was more than 10-times higher than the development costs for a typical diagnostic.  Drugs take longer to develop, and have a much higher risk of failure.  The regulatory hurdles are much higher for drugs than diagnostics.  And in any case, the need for the diagnostic only became clear because of the success of the drug.  In short, 6% of the overall returns for the diagnostic partner in such a situation sounds generous.

However, the situation in oncology, where the vast majority of companion diagnostic products currently on the market are located, hides a bigger issue: the difficulty in earning rewards for genuine innovation in the field of diagnostics.  In oncology, not a great deal of innovation is required on the companion diagnostic side, since the test is tightly tied to the mechanism of action of the associated therapeutic.  In such situations, there is virtually no technical risk associated with the development of the diagnostic product.  The only risk is regulatory risk (which is relatively easy to mitigate, at least for the big players who well understand the process) as well as risk that the associated therapeutic fails to win regulatory or market acceptance – in which case sales of the diagnostic product will also be non-existent.

But in other indications, finding companion diagnostics will require much more innovation.  For example, in chronic inflammatory diseases picking people who might show the best responses to anti-TNFs requires something more innovative than tests for genetic variation in the TNF-a gene or its receptors.  Because the biology of inflammation is complex, predicting the responses to drugs (even those with well defined molecular mechanisms) is a substantial challenge – a challenge that, for the most part, remains unmet.

Indeed, in some cases innovations in biomarker discovery might actually drive new therapeutic approaches:  the management team of Total Scientific, in collaboration with Imperial College, London, discovered that low circulating levels of the amino acid proline is a powerful new biomarker for osteoporosis, predicting fracture risk as well as low bone mineral density.  This finding not only suggests that a diagnostic assay for serum proline may be clinically useful, but that therapeutic strategies directed to modulating proline metabolism may also be effective.  Our innovation in biomarker discovery may ultimately open up a whole new field of bone biology, spawning multiple high value therapeutic products.

In these situations where innovation is required in both the diagnostic and therapeutic domains (which will probably prove to be the majority of personalized medicine product combinations), a business model that splits the revenues 94% to the drug developer and 6% to the diagnostic developer seems skewed.  If the driving innovative step came from the biomarker end (as in the example with proline), the team with the original insight may hope to reap at least half the reward.

There are two major reasons why this is unlikely to happen: firstly, there is a glass ceiling on price for a diagnostic product.  Paying more than $200 or so for a molecular diagnostic, no matter how innovative or complex, is contrary to almost every healthcare reimbursement system worldwide.  Secondly, the barriers to prevent competition against the therapeutic component of the product combination are very high indeed (both from regulatory and intellectual property perspectives).  But in marked contrast, the barriers to prevent another competing product being launched against the diagnostic assay component of the combination are very much lower.

These two factors will likely combine to restrict the return to innovators in the diagnostics space relative to those in the therapeutic space, irrespective of the apparent value of their innovation.

This state of affairs is bad for everyone.  It limits the incentive for real investment in biomarker discovery independent of therapeutic development, so the chances of finding innovative new companion diagnostics outside of oncology are materially reduced.  As a result, even though (for example) a new test to determine which RA patients might respond best to anti-TNFs would be beneficial to patients (avoiding exposing patients to the drug who will not benefit and immediately giving them the opportunity to try something else without waiting 6 months to see of they responded), and also beneficial to payors by reducing the number of patients treated with an expensive drug.  Indeed, the economics of such a test might sustain a price for the product that was well above $200.

Yet the second problem would then intervene to drop the price: competition.  Since it is (usually) impossible to protect the concept of measuring a particular analyte (and is only possible to protect a particular methodological approach to its measurement), others would most likely be free to develop different assays for the same analytes.  As the regulatory hurdles for developing competing tests is low – particularly once the first test has been launched, since fast-followers need only demonstrate equivalence – it would not be long before the first product to successfully predict responses to anti-TNFs among RA patients would be subjected to competition, driving prices back down again.

Subtle though they seem, the differences in the IP and regulatory landscape for diagnostic tests compared with therapeutics, threaten the viability of the personalized medicine business model.  Delivering on the promise of personalized medicine for both patients and the healthcare industry requires allocation of capital to drive innovation in both biomarker discovery and identification of novel therapeutic targets.

At first sight, developing diagnostic products, as opposed to therapeutics is relatively attractive.  The limited demand on capital, short time-line to product launch, low technical and regulatory risk and the substantial medical need all favour developing diagnostic products.  But not if the discovery component becomes lengthy and expensive.  In other words, developing “me-better” diagnostics makes a lot of commercial sense, but investing in genuine innovation in biomarkers still looks unattractive.  And it is precisely these highly innovative new diagnostic products that will underpin the delivery of personalized medicine.

What can be done?  Not a great deal in the short term, perhaps.  But in the longer term, much needed reforms of the regulation of diagnostic products might raise the barrier to competition against first-in-class assay products.  The current regulatory framework for therapeutics is draconian, demanding very high levels of safety from every aspect of the drug product, from manufacturing to long-term side-effects.  By contrast, despite some tinkering in recent years, the diagnostic regulatory framework remains relatively lax.  Home-brew tests are introduced with little regulation of manufacturing standards, and the focus of the regulators is on the accuracy of the measurement rather than on the clinical utility of the result.  This leaves open a weak-spot in the overall protection of the patient, since an inaccurate diagnosis (leading to incorrect treatment) can be as harmful for the patient as treatment with an inherently unsafe medicine.  Just because molecular diagnostics are non-invasive, it doesn’t mean their potential to harm the patient is zero.

There are moves to close this loophole, and the unintended consequence of such regulatory tightening will be an increased barrier to competition.  Perhaps the addition of a period of data-exclusivity, much as applies in the therapeutics world, could be added in addition to further protect truly innovative diagnostic products from early competition.

Such moves are essential to make innovation in biomarkers as commercially attractive as innovation in therapeutics.  It will be difficult to achieve in practice, however, as pressure on healthcare costs ratchets up still further over the coming decade.  Competition, lowering prices, is on the surface attractive to everyone.  But it is the differing protection from competition between therapeutics and diagnostics that leads to skewed incentives to invest in innovation in one area rather than the other.  Lets hope that once combinations of therapeutics and companion diagnostics start to appear outside of oncology, the relative pricing of the associated products properly reflects the innovation in each of them.  If it doesn’t, our arrival in the world of truly personalized medicine may be delayed indefinitely.

Dr. David Grainger
CBO, Total Scientific

Ultra-sensitive NMR-based diagnosis for infectious diseases: the tortoise races the hare again

Obtaining rapid and reliable diagnosis of infectious diseases is usually limited by the sensitivity of the detection technology.   Even in severe sepsis, accompanied by organ failure and admission to an intensive care unit, the causative organism is often present at a level of less than one bacterium per milliliter of blood.  Similarly, in candidiasis the yeast cells are present at vanishingly low levels in body fluids, while in chlamydia infections the pathogen is located intracellularly as is entirely absent from the blood fluid.

All these (and many other) pathogens have evolved to escape detection by the immune system, and its antibody sensors.  This, coupled with the low levels of organisms in samples from infected individuals, means that antibody-based diagnostic tests rarely have enough sensitivity to be useful.

Then came PCR.  The big selling point of the polymerase chain reaction is its exquisite sensitivity, while retaining useful specificity.  Under optimal conditions you can detect a single DNA molecule with this technique.   Surely PCR was going to revolutionize infectious disease diagnosis?

Not really.  There are several problems: the very low levels of infectious organisms in the samples means that there is a very large amount of other DNA (from the host cells) in the sample.  Unless some kind of enrichment is performed, the PCR reaction cannot achieve the necessary sensitivity in the presence of so much competing DNA template.  Secondly, DNA from dead organisms is detected just as efficiently as from live ones, and worse still DNA released from the dead organisms can persist in the blood for weeks and months.   Together, these issues lead to high rates of both false positive and false negative findings, and for many infectious diseases such simple PCR tests perform too poorly in the clinic to be of value.

A common solution that deals with both these problems is to culture the sample prior to running the test.  The rapid growth of the infectious organism enriches the sample with the target DNA template, and at the same time differentiates viable organisms from dead ones.  PCR on cultured samples usually achieves the necessary sensitivity and specificity to be clinically useful – but for severe disease, such as sepsis, the time taken to culture the sample (which may be several days) is critical when the correct treatment needs to be started immediately.

As a result, there is still a massive product opportunity for new infectious disease diagnostics.

One approach is to try and confer on the PCR tests the specificity for live organisms, and at the same time improve the ability to distinguish template from the organism from the high levels of host DNA.  A particularly promising solution from Momentum Biosciences is to employ the DNA ligase enzyme from live bacteria to ligate added DNA template to create an artificial gene that is then amplified by conventional PCR.  The product is still in development, but it offers real hope of a sepsis test that can identify live organisms in less than 2 hours.

But another potential solution comes from a much more surprising approach: using nuclear magnetic resonance (NMR) spectroscopy.  NMR offers exquisite specificity to distinguish molecules in a sample based on their chemical structure, a property that underpins the use of the technique in metabolic profiling.  However, as anyone who has ever tried to exploit this elegant specificity will tell you, the problem with NMR is its lack of sensitivity.  Even with cutting-edge equipment, costing millions, the sensitivity limit is usually above 10µM (which equates to a million million or so molecule per milliliter of sample.  Not much use, one might think, for detecting a single cell in a milliliter of blood.

But T2 Biosystems, based in Lexington, MA, have found a neat solution to the sensitivity problem of both antibodies and NMR.  By coating highly paramagnetic beads with antibodies specific for the infectious organism, they can readily detect the clumping of these beads in the presence of very low levels of antigen.  Again, the test is in development, but the company announced last week the closing of a $23M series D investment to bring the system to market.

There is an attractive irony in using a technique famed for its ultra-low sensitivity to solve a problem where sensitivity of detection was the limiting factor.  In the race to find clinically useful diagnostic tests for many infectious diseases, just as in Zeno’s race between the hare and the tortoise, the super-sensitive PCR took a massive early lead and for a long time looked like the only winner in an arena where the major barrier to success was sensitivity of detection.  But the wily old tortoise is not out of it yet: an ingenious twist added to low-sensitivity NMR might still win the race to clinical and commercial success in the infectious disease diagnostic arena.

Dr. David Grainger
CBO, Total Scientific Ltd.
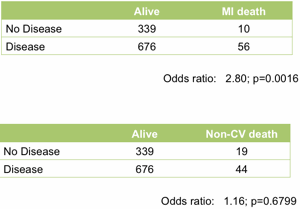
Chemokines as biomarkers for cancer: Time to revisit an old friend?

A wide-ranging study pre-published on-line in Nature last month points the finger at the chemokine CCL2 (also known as MCP-1, or JE in mice) as a key regulator of tumour metastasis.  Intriguingly, CCL2 seems to participate in the generation of clinically-relevant metastatic disease on multiple levels: it promotes seeding of the shed metastatic cells, but it also promotes establishment and growth of the micrometastases, a process that is dependent on VEGF production from a tissue macrophage subset that responds to CCL2.  All this nicely suggests that CCL2 (and its signaling pathway) may be an attractive therapeutic avenue for reducing the risk of metastasis.  The close links between the academic authors and the global pharmaceutical company Johnson & Johnson suggests that this avenue is already being aggressively pursued.

But what about CCL2 as a biomarker for detecting early metastasis and directing treatment?  The study shows that the density of CCL2-expressing macrophages in the region of the metastasis is associated with disease progression, so it seems plausible that measuring CCL2 levels in appropriate biological samples (whether tissue or blood) might be a productive investigation.

All this has special resonance for scientists at Total Scientific.  A decade ago, similar data (here and here) linking CCL2 to the mechanism of atherosclerosis and vascular restenosis prompted us, among others, to investigate whether circulating levels of CCL2 might be predictive of coronary heart disease.

The bottom-line finding (that CCL2 levels in serum are not linked to heart disease) was disappointing.  But the process of getting to that conclusion was highly instructive.  CCL2 binds to blood cells through both high affinity (receptor) interactions and lower affinity (matrix) associations.  The amount of CCL2 bound to signaling receptors is essentially irrelevant for the measurement of CCL2 in blood, but the lower affinity associations turned out to be much more significant.  As much as 90% of the CCL2 in blood is bound to the enigmatic Duffy antigen on red blood cells (enigmatic because this receptor seems to be related to chemokine receptors but lacks any kind of signaling function).   Worse still, this equilibrium is readily disturbed during the processing of the blood sample: anticoagulants such as heparin or EDTA shift the equilibrium in one direction or the other altering apparent CCL2 levels.  Minor variations in the sample preparation protocol can have dramatic effects on the measured levels – whether between studies or within a study – not a good sign for a biomarker to achieve clinical and commercial utility.

And it’s not only ex vivo variables that affect the equilibrium: red blood cell counts differ between subjects, with women typically having lower red blood cell counts and lower total CCL2 levels as a result.  Since women also have lower rates of heart disease, a widespread failure to recognize the complexity of measuring CCL2 in blood fractions most likely contributed to a number of false-positive studies.    Needless to say, almost a decade on from those positive studies, CCL2 has not found a place as a biomarker for heart disease probably because, as we discovered, the reported associations had their origins in a subtle measurement artifact.

Does this mean CCL2 is unlikely to be a useful biomarker for metastatic potential among cancer sufferers?  Not at all.  But it does mean that studies to investigate the possibility will have to be much more carefully designed than is typically the case.  Learning from our previous experiences studying CCL2 levels in heart disease patients, the Total Scientific team has assembled the necessary tools to address this question in cancer.

However, an old adage among biomarker researchers comes to mind: “If it looks simple to measure, it probably means you don’t know enough about it”.

Dr. David Grainger
CBO, Total Scientific Ltd.